| Slide rules HOME page | PRICES | < SITE MAP > |
Trend line analysis
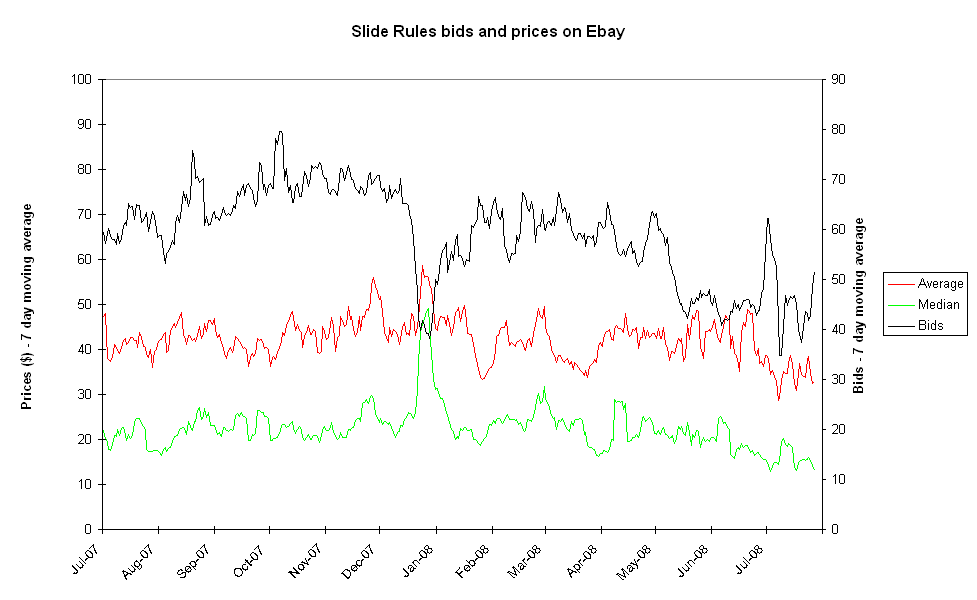
The following chart plots average price, median price and number of bids extracted from information put on line by ebay, the "on-line" auction.. The data were analysed on a day-by-day basis. The data are plotted as 7-day moving averages. (That is, the plotted position for a given day is based on the average of the values for that day, the preceding 3 days and the following 3 days. This smoothes out any large day-to-day variations).
