| Slide rules HOME page | PRICES | < SITE MAP > |
Hourly variation in price and sales
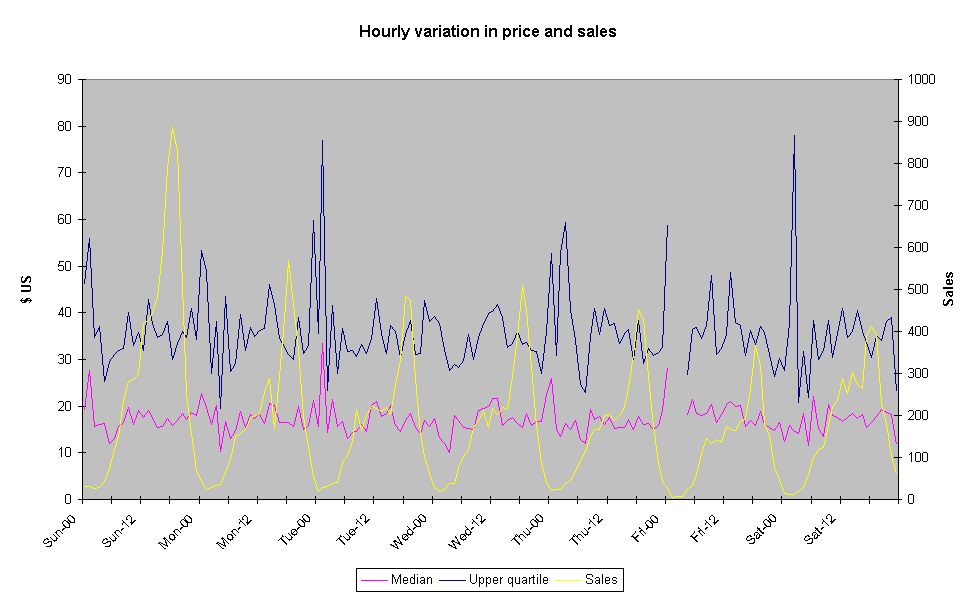
The analysis below examines the variation in prices and sales of slide rules on ebay on an hourly basis. The data used are for the period mid-November 1999 to the end of February 2002; a period of over 2 years. Prices are presented for the median (actually the average of the 5 values closest to the median) and the upper quartile (actually the average of 3 values closest to the upper quartile). Only events with more than 10 sales at a particular time on a particular day were included in the graph.
The median, incidentally, is the "half way" price with 50% of the items costing more and 50% costing less than the median. It will be close to the average price but, unlike the average, will not be affected by sale of a few very expensive items. Similarly, 25% of the times sold will cost more than the upper quartile and 75% will cost less.
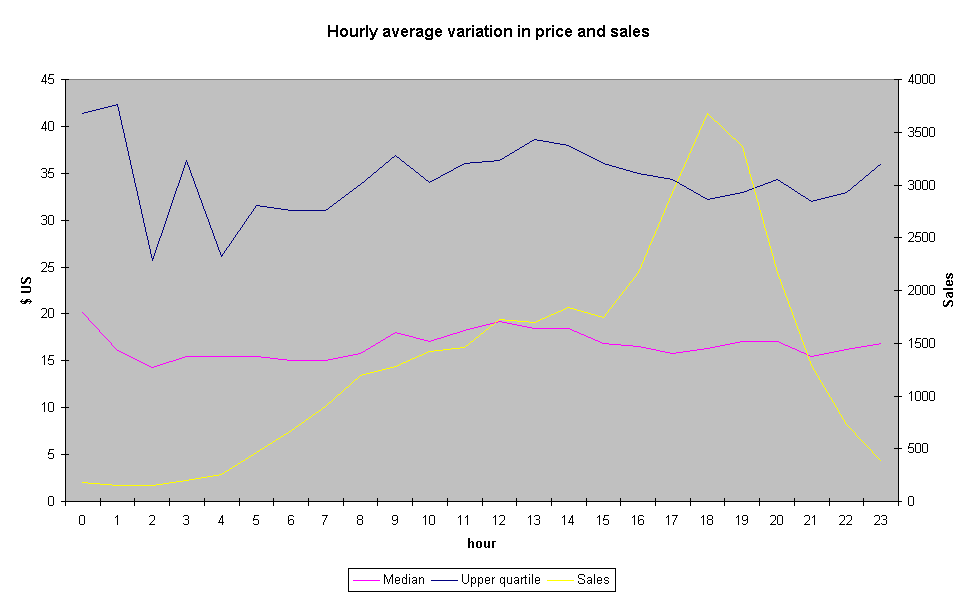
What the graphs show, not surprisingly, is that there is a marked peak in sales in the late afternoon PST, particularly on the Sunday. More surprising is the fact that the price drops at the time of maximum sales. In fact the best time seems to be around 4 hours before or 4 hours after the time of maximum volume. Rather intriguingly, the graphs also suggest that the best time to sell expensive rules is between close to midnight. Another good time for sales is around lunch time. The best time to buy is early evening - around the time of maximum sales.
The first graph show the variation, hour-by-hour for a whole week.

The second graph shows the hourly variation averaged over all seven days of the week.

The final graph shows the average sale price for each day of the week. Thursday would appear to be the best day to buy and Friday to sell.
